
This is the August 2025 Real Estate Market Update for Loveland CO
Sales:
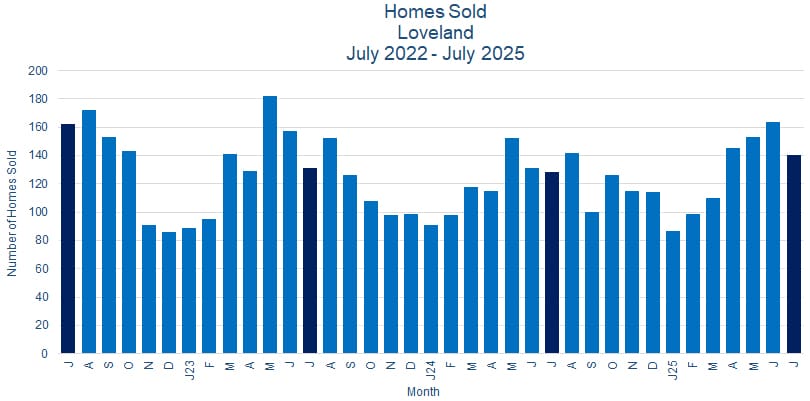
Home sales in Loveland CO declined in July 2025. There were 140 homes sold, a drop of 14.6% from the 164 sold in June 2025, but a gain of 9.4% from the 128 homes sold in July 2024. Year-to-date sales of 898 were up 7.8% from last year’s 833 for the same period.
Prices:
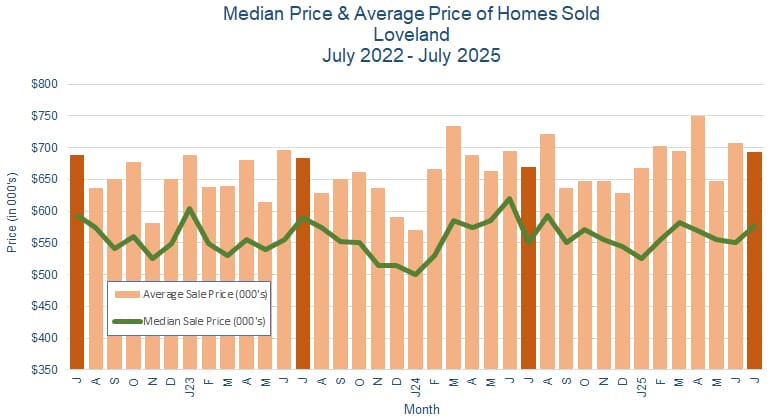
Home prices were mixed in July 2025. The median price rose 5.1% to $578K from $550K in June 2025, while the average price fell 2.0% to $693K from $707K for the same period. Please keep in mind that these results reflect only those specific homes sold during the month and are therefore subject to random variations, while the overall price trends give a better idea of what is happening.
Inventory:
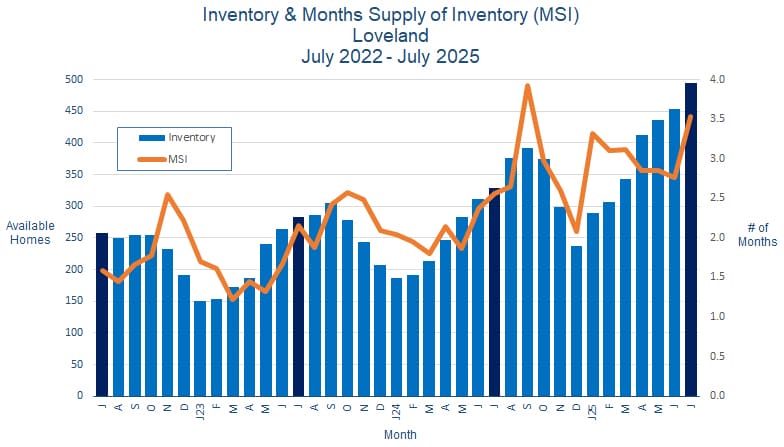
The inventory of available homes increased in Loveland CO in July 2025. There were 494 homes for sale at the end of the month, a gain of 8.8% from the 454 homes for sale at the end of June 2025. The Month’s Supply of Inventory (MSI) rose to 3.5 months from June’s 2.8 months.
Sales Price vs. List Price:
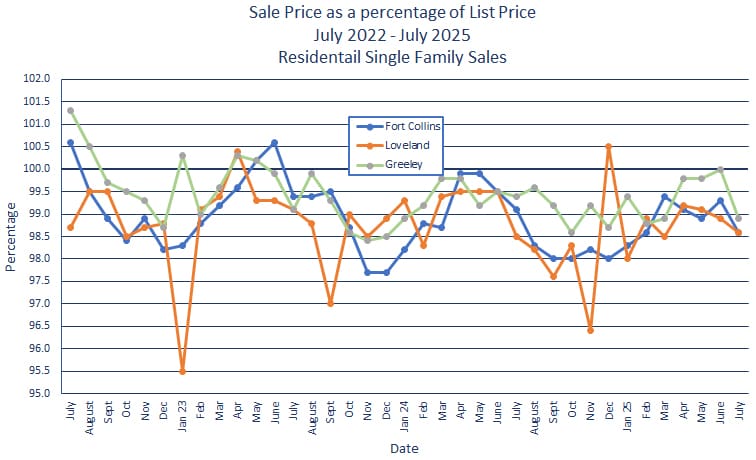
In July 2025, homes in Loveland CO sold for 98.6% of asking price, down slightly from 98.9% in June 2025.
Summary:
As the graphs above show, there isn’t anything particularly unusual about July 2025’s numbers – the sales declines and inventory increases of this year have generally followed past trends, and prices have been a bit more stable over the range, while varying more month-to-month, as would be expected. And overall, this year’s results have been comparable to last year’s.
It is important to note, however, that all of the data compiled in these reports represent lagging economic indicators – in other words, the numbers follow economic events, rather than lead them. This is because the buying decision – i.e. when a contract is made for the sale of a home – generally happens 1-2 months prior to the actual transaction’s occurrence, and hence its appearance as data. So our charts reflect a snapshot of the economic “mood” of the very recent past, rather than what’s happening right now.
We do have some leading economic indicators to rely on – things like the number of new homes coming on the market, showing activity for currently listed homes, interest rates, home-building activity, regional employment trends, etc. So when the economy is fairly stable, we’re able to make some reasonable projections about where the regional housing market is headed. But those projections become difficult when future economic events become less predictable. And that uncertainty has a major effect on the decision to buy and sell homes.
All of which is a long-winded economist’s way to say that’s it’s currently very difficult to make reasonable projections for what’s going to happen in the near future in regards to the Northern Colorado housing market. But as always, we’ll be closely watching the market, and we’ll keep you informed about what we’re seeing. And in the meantime, if you have any questions or just want to chat, don’t hesitate to give us a call - we’re always available to talk with you.