
This is the September 2023 Real Estate Market Report for Loveland CO
Sales:
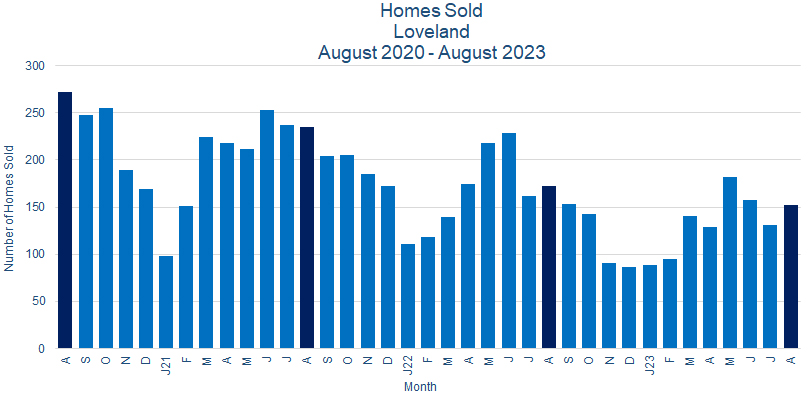
Loveland CO home sales rose in August 2023. There were 152 homes sold, up 16.0% from the 131 sold in July 2023, but down 13.1% from the 172 homes sold in August 2022. 96 of these homes, or 63.2% of the total sold, were priced over $500K. 2023 year-to-date sales of 1,076 homes were down 18.8% from 2022’s 1324 sales for the same period.
Prices:
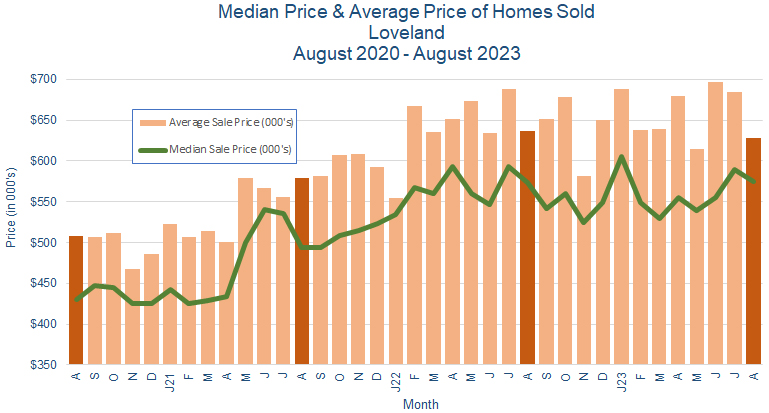
Home prices declined in August 2023. The median price fell 2.6% to $575K from $590K in July 2023, while the average price dropped 8.2% to $628K from $684K. Please keep in mind that this number reports the specific sales during the last month and is subject to random market variations as well as specific market driven causes – it therefore needs to be considered in a broader time period context.
Inventory:
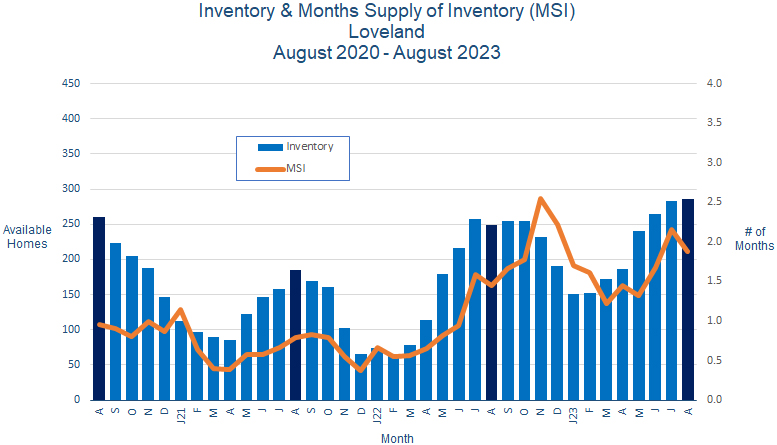
Inventory rose slightly in Loveland CO in August 2023, with 286 homes for sale at the end of the month, up 1.0% from 283 at the end of July 2023. The month’s supply of inventory fell to 1.9 months from 2.2 months in July 2023, as sales grew faster than inventory.
Sales Price vs. List Price:
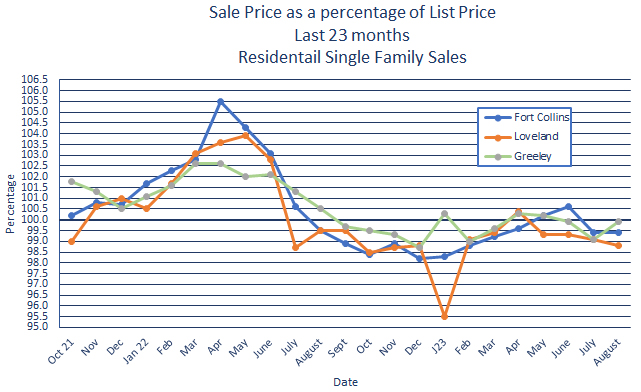
In August 2023, homes in Loveland sold for an average of 98.8% of list price, down from 99.1% in July 2023.
Summary:
So, how’s the Loveland CO housing market doing? It’s complicated.
Sales and inventory rose while prices fell in August 2023. Hmmm. Falling home prices and rising sales and inventory could be signaling that sales activity may not have peaked for the year. But they could also suggest a market correction. And we’re entering what has in the past been a slower market period.
It’s never a great idea to base predictions on a single data point – in this case, one month of data that may or may not signal some changes in market conditions. This is certainly true in markets subject to external forces that are themselves a bit chaotic and potentially of great significance. And it’s particularly true in markets like ours where recent historical data has been impacted so strongly by those externalities.
So, while sales were up over last month, that isn’t the indicator we’re looking most closely at – its importance is somewhat discounted by the fact that a substantial portion of those sales, 63.2%, were in upper price ranges.
Overall, prices and interest rates are still rising, and incomes are still mostly stagnant. Additionally, a growing affordability gap remains a problem for a significant percentage of our residents. The effect of all of that, combined with impacts from externalities, is that the pools of both potential home buyers and home sellers are showing more caution and hesitancy, resulting in a contracting market. The market itself could be considered relatively stable, even if it’s somewhat smaller than before, and structurally flawed.
But forecasting our housing market isn’t going to depend on what happens here. With the housing market subject to changing market forces – rather than when it was a major driver of them – as well as those externalities mentioned above, we certainly have less clarity about where we’re headed. And it’s our belief that greater certainty about those externalities will be required before we can make any reliable predictions. We’ll still be here telling you what has happened, and why – but we’re all going to have to wait to see how it’s all going to play out.