
This is the July 2023 Real Estate Market Report for Loveland CO
Sales:
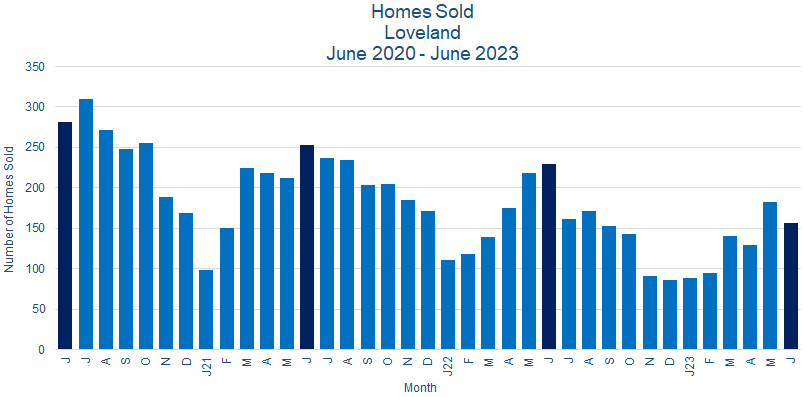
Loveland CO home sales declined in June 2023. There were 157 sales, a drop of 13.8% from the 182 sold in May 2023, and a drop of 31.4% from the 229 homes sold in June 2022. 101 homes, or 64.3% of the total sold, were priced over $500K. 2023 year-to-date sales of 793 homes were down 19.9% from 2022's 990 sales for the same period.
Prices:
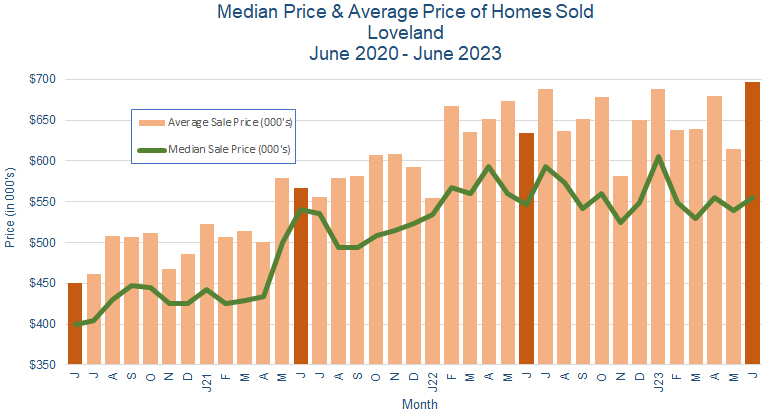
Home prices increased in May 2023. The median price gained 2.9% to $555K from $539K in May 2023, while the average price gained 13.4% to $696K from $614K. Please note that this data only covers those specific homes sold during those two months, while the price trend over the last year remains generally flat.
Inventory:
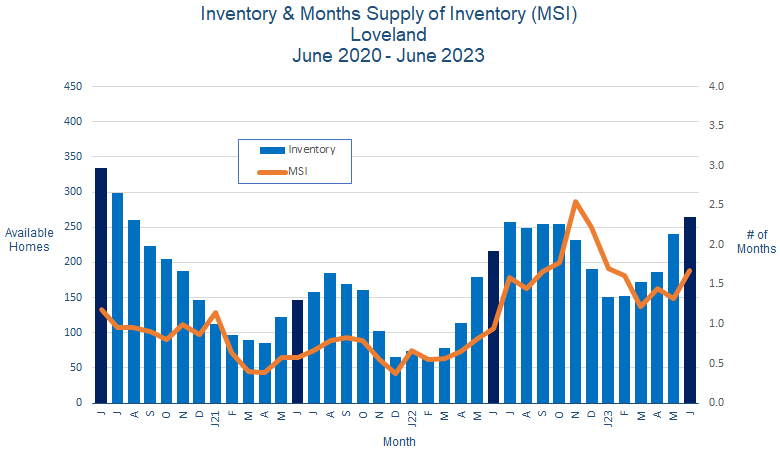
Loveland CO home inventory rose again in June 2023, with 264 homes for sale at the end of the month, up 9.5% from 241 at the end of May 2023. The month's supply of inventory rose to 1.7 months from 1.3 months the previous month, as inventory grew and sales declined.
Sales Price vs. List Price:
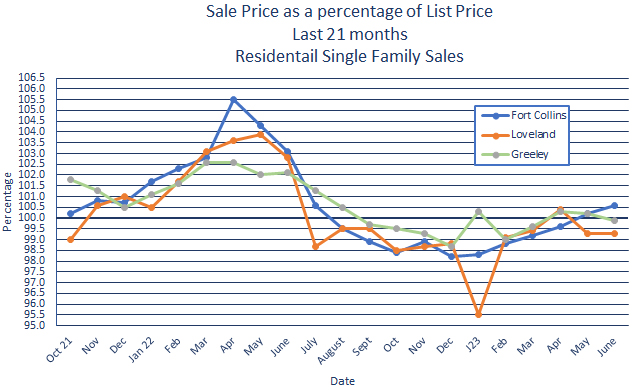
In June 2023, homes in Loveland sold for an average of 99.3% of list price, unchanged from May 2023.
Summary:
Sales were down, inventory up, and prices essentially unchanged, and this during what is normally the best month on the calendar for real estate sales. Here's what we think is happening:
First of all, uncertainty about the overall economy seems to be affecting home-buying decisions, as potential home buyers are less willing to make big investment decisions. Interest rate increases have taken a toll on the pool of qualified buyers, inflation has not yet been tamed, and job stability concerns remain.
But of more concern is the shift in the structure of our local real estate market. The above-mentioned issues have been magnified by our own recent home price increases, which have moved home ownership beyond the reach of a significant number of area residents who in the past would have been able to afford a home.
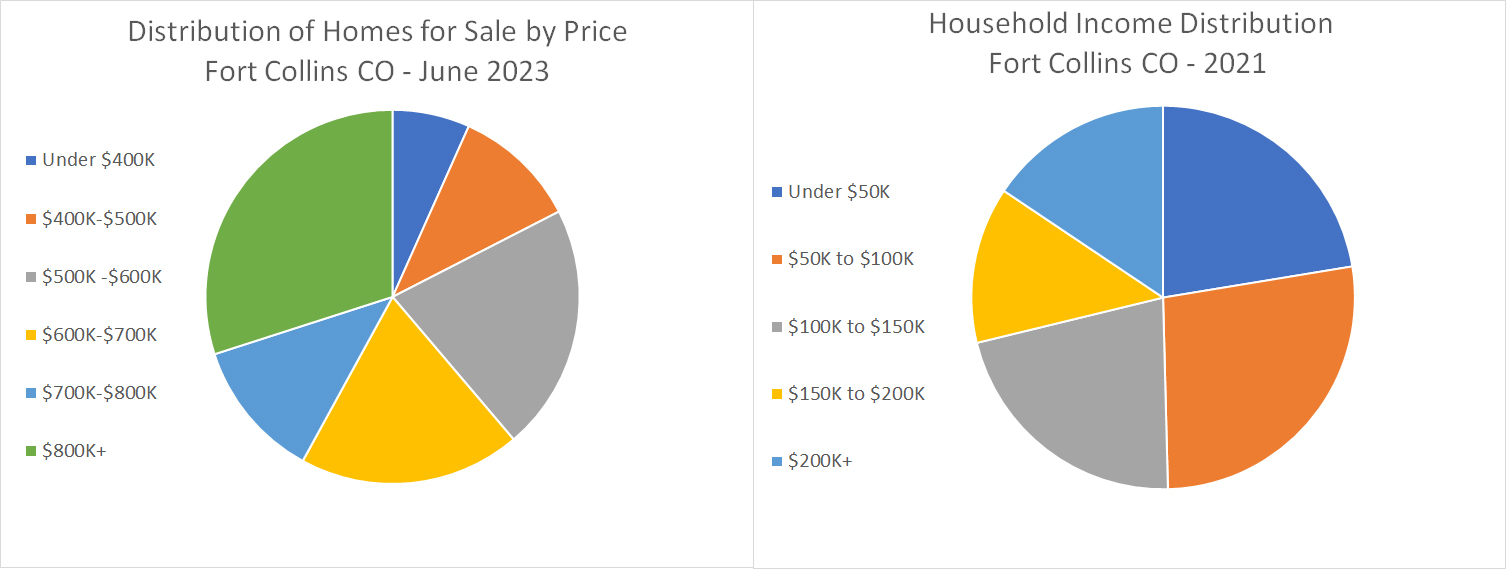
While the charts above illustrate the current situation in Fort Collins, they are indicative of all of the Northern Colorado real estate markets. On the one hand, the percentage of homes for sale in the more expensive price range has increased, and last month accounted for a great majority of those homes sold. But the second chart, which shows household income distribution estimates for Fort Collins, shows how little of our population can afford even "inexpensive" homes. For example, to afford a $400K home, a family with a minimum down payment, limited debt and decent credit would need an annual income of around $75K.
What's happened is simply that a decrease in the number of qualified buyers, combined with increasing prices, has shrunk the real estate market. We're most likely going to see fewer homes sold, more inventory available, and longer times on market. And it's unlikely to change significantly until the economy begins improving for everyone.